Organizing Data
. Return to Water Project Index
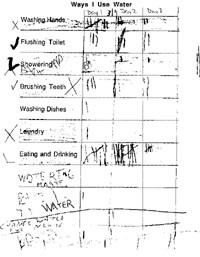
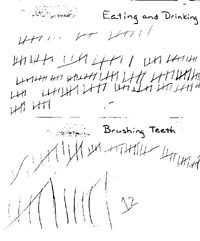
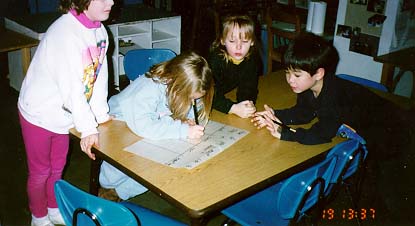
Students conducted surveys with each other as well as answering sign-in questions or home surveys, tallied the results, and organized the data into bar graphs and pie graphs.
.